Why Purpose-Led Branding in India Is Winning Consumer Trust in 2026
Why Purpose-Led Branding in India Is Winning Consumer Trust in 2026 Purpose-led branding in India is winning trust because Indian...
Read More → 
THE BEST MARKETING CONSULTANT IN DELHI
If you’ve ever opened your ad account and felt more confused after looking at the numbers than before, you’re not alone. Most performance marketing reports are built to look impressive, not to tell you whether your money actually worked. Clicks go up, impressions climb, “engagement” looks healthy — and none of it tells you if you made a rupee back. Reading performance marketing reports correctly means learning which numbers actually connect to revenue and which ones just make a dashboard look busy.
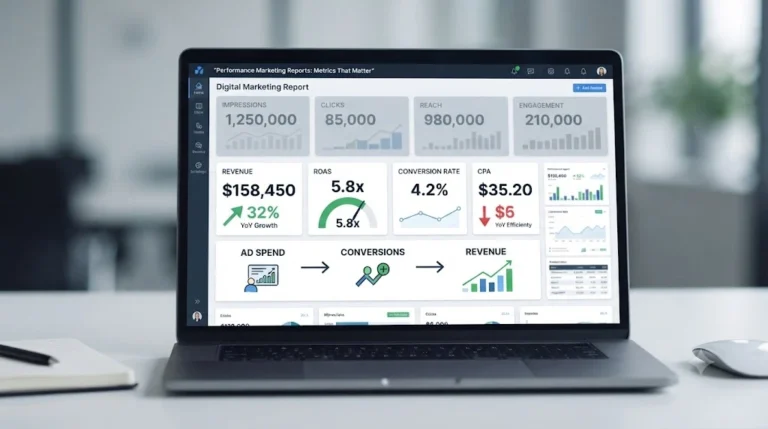
Ad platforms surface reach, impressions, clicks, and engagement front and center because those numbers move fast and almost always trend upward. They’re easy to generate and easy to feel good about. But none of them tell you what happened after the click. A campaign can pull in thousands of clicks and still lose money if nobody converts once they land on your site.
This is the core of the ROAS vs vanity metrics problem: platforms optimize for what’s easy to measure, not what’s easy to spend. Return on ad spend (ROAS) — revenue generated divided by ad spend — is one of the few numbers in a report that directly tells you if a campaign is profitable. A campaign showing 4x ROAS and modest impressions is doing more for your business than one with huge reach and a 0.8x return.
When you’re doing real marketing KPI tracking, a handful of numbers deserve most of your attention:
Impressions and click-through rate still matter, but only as diagnostic numbers — they tell you if your creative or targeting is catching attention, not whether the campaign is making money.
A report is only as honest as the conversion tracking behind it. If your pixel is misfiring, if you’re double-counting conversions across platforms, or if you haven’t set up server-side tracking after iOS privacy changes broke a chunk of browser-based tracking, your “conversions” column can be flat-out wrong — sometimes inflated, sometimes undercounted.
Before trusting any ad performance reporting dashboard, it’s worth checking three things: is the pixel firing on the actual purchase confirmation page (not the cart page), are you seeing duplicate conversion events across Meta and Google for the same sale, and does your reported revenue in the ad platform roughly match what your store’s own order data shows for that period. If those three don’t line up, everything downstream of them — ROAS, CPA, channel comparisons — is built on a shaky number.
Open Meta Ads Manager and Google Ads side by side for the same week, and the conversion numbers almost never match. This isn’t a bug — it’s how attribution reporting works. Each platform credits itself generously using its own attribution window (often 7-day click, 1-day view), so a single sale can get claimed by two or three channels at once.
The fix isn’t picking whichever platform reports the bigger number. It’s setting one source of truth — usually your own analytics or order data — and treating the ad platforms’ numbers as directional, not exact. A marketing dashboard that pulls from your actual sales data and layers ad spend on top gives a far more honest read than trusting any single platform’s self-reported conversions.
Skip the top-line summary tile most dashboards open with. Instead:
This order matters more than most people realize. Reading top-down (impressions first) trains you to feel good about the wrong things before you get to the numbers that decide whether the campaign was worth running.
It depends entirely on your margins. A brand with 60% margins can be profitable at 2x ROAS; a brand with 20% margins might need 5x or more just to break even after product cost and fulfillment. There’s no universal “good” number — it has to be calculated against your own cost structure.
Each platform uses its own attribution window and takes credit for conversions it may have only partially influenced. This is normal and expected — treat platform-reported numbers as directional, and use your actual order data as the source of truth.
No — they’re useful diagnostic signals for creative and targeting performance. The mistake is treating them as success metrics instead of context. They explain why a number moved; they don’t tell you if the campaign made money.
Weekly for trend-spotting, but decisions on budget shifts or pausing campaigns are usually more reliable when based on a rolling 3-4 week view rather than any single week, since ad platforms have natural day-to-day and week-to-week noise.
CPA usually climbs as you scale spend within the same audience — you exhaust the cheapest, most responsive segment first and start paying more to reach the next layer. ROAS can hold steady if average order value or margin is compensating, so the two numbers need to be read together, not in isolation.
Blended ROAS can hide a lot. One strong campaign can offset one that’s losing money, and the account-wide number still looks fine. Breaking ROAS out by campaign — and ideally by product category — shows you exactly where the budget is working and where it’s being wasted.
Last-click gives 100% of the credit to whichever channel got the final click before purchase, which tends to overvalue bottom-funnel channels like branded search or retargeting. Multi-touch spreads credit across the touchpoints in the path, giving a more balanced (though harder to calculate) picture of what actually influenced the sale.
This usually points to tracking issues: duplicate pixel firing, a pixel that fires on the cart page instead of the confirmation page, or the same purchase being counted by more than one ad platform. It’s worth reconciling ad-reported conversions against actual store order data regularly rather than assuming the dashboard number is accurate.
Platform reports are fine for platform-specific diagnostics, but they’ll always favor themselves in attribution. A dashboard that pulls from your own sales data and lays ad spend on top of it gives a far more honest, single source of truth — especially once you’re running on more than one ad platform.
It changes what user data can be collected and how consent needs to be captured, which has downstream effects on pixel-based and browser-based tracking. It’s worth understanding before making any changes to your tracking setup — see the linked DPDP Act post for the details.
If your own reports still feel more confusing than clarifying, Ritwik Sachdeva offers a walkthrough call where you go through your actual dashboard together and figure out what your numbers are really telling you — no generic audit, just your data explained in plain terms. Reach out at 9289626386 or visit ritwiksachdeva.in to book one.